R: Create Empty Plots
Posted on: 2023-02-15
Tags:
- R
- plot
Do you know you can create empty plots in R?
Sometimes, you just want to create an empty plot in R...
Just want to remove everything? ↓↓ TLDR ↓↓.
The good old plot command
First, let get ourselves some data.
set.seed(42)
y1 <- rnorm(10)
x1 <- seq_along(y1)
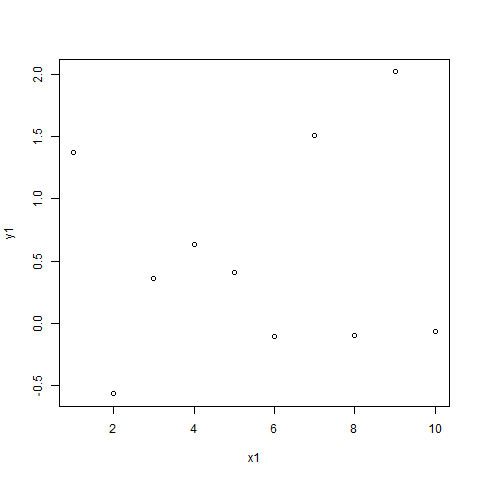
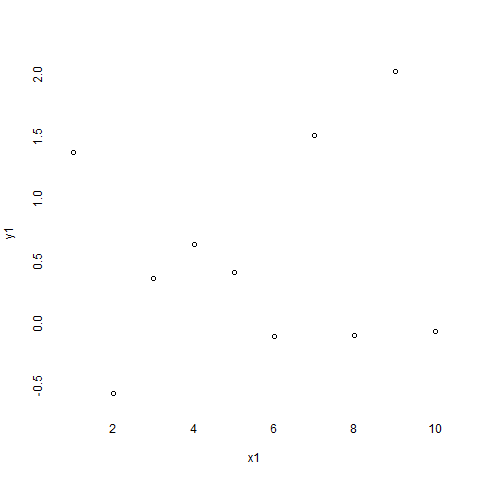
A Typical Plot
Plotting it in a normal way:
plot(x1, y1)
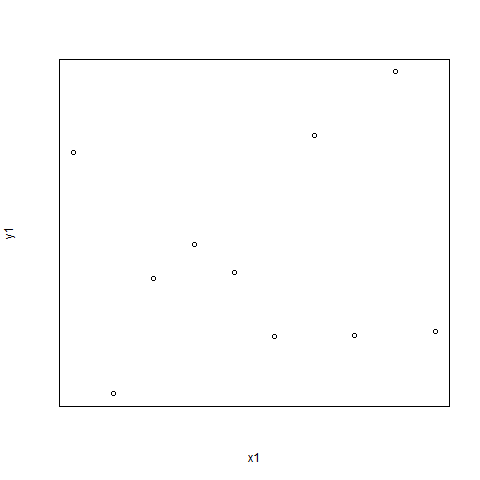
Remove the labels (and titles)
The obvious way
plot(
  x1, y1,
  xlab = "", ylab = "",
  main = ""
)
An alternative way
plot(
  x1, y1,
  xlab = "Oh no I'm gone", ylab = "Oh no I'm gone",
  ann = FALSE # <- added this
)
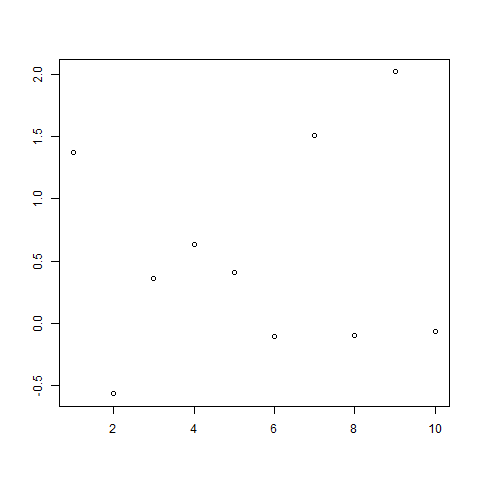
Remove some ticks
plot(
  x1, y1,
  xaxt = "n", # suppress x-ticks
  yaxt = "n" # suppress y-ticks
)
Remove the points
plot(x1, y1, col = rgb(0, 0, 0, 0)) # Set alpha to 0
Remove surrounding box
plot(x1, y1, fg = rgb(0, 0, 0, 0)) # Set alpha to 0
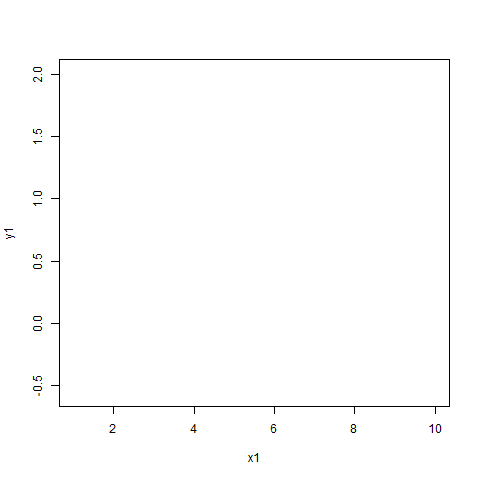
Remove everything!? (Part 1)
plot(
  x1, y1,
  xaxt = "n", yaxt = "n",  # ticks
  ann = FALSE,             # labels + titles
  fg = rgb(0, 0, 0, 0),    # surrounding box
  col = rgb(0, 0, 0, 0)    # data points
)

You are loking at an empty white image.
Remove everything!? (Part 2)
But wait, there's more. The image is still white. Lets plot a transparent one 😎.
png(
  filename = "empty-Rplot.png",
  bg = rgb(0, 0, 0, 0)
)
plot(
  x1, y1,
  xaxt = "n", yaxt = "n",  # ticks
  ann = FALSE,             # labels + titles
  fg = rgb(0, 0, 0, 0),    # surrounding box
  col = rgb(0, 0, 0, 0)    # data points
)
dev.off()
transparent image below ↓

You are loking at an empty transparent image ↑.
Note: Not all image formats support transparent background, e.g. .jpg files